
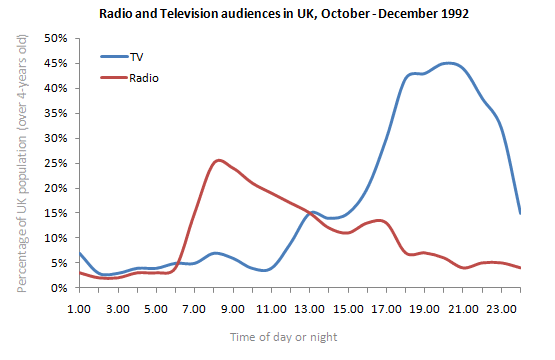
The graph above shows radio and television audiences throughout the day in 1992. Write a report of at least 150 words, summarizing the key details and making comparisons where relevant. THINGS TO REMEMBER BEFORE WRITING (1) Line graphs require you to report trends. Think about (i) peaks and lows (ii) periods where there are big/fast […]
#English #ELT #ESOL #ESL #EFL #TESOL #Language #LearnEnglish #EnglishLesson #StudyEnglish #IELTS #Writing
via IELTS Reports: Line Graphs – Radio and Television — IELTS UNLOCKED